You’ve built a profitable ecommerce business—your shop is running smoothly, your fulfillment process has been optimized, and you finally have some time to think about how to scale.
So where do you start? What’s the most important area to focus in on when you’re trying to develop new strategies, set new budgets, and uncover new opportunities?
The answer is data.
These days, it’s not very difficult to set up and launch an ecommerce shop—in fact, I’d argue that it’s probably never been easier. What is hard, though, is pushing the right buttons to drive growth.
To figure out how to take your ecommerce business to the next level, you could use the extra time you have to get lost following link-baity case study headlines that never seem to deliver the value you expect…or you could roll up your sleeves, plug in your computer charger, and start digging deep into data.
If you’re ready to get your hands dirty with data, read on. This post will teach you how to find and leverage retail trend data to grow your ecommerce business.
Why Use Data / Where to Find It
To move the needle, you need to be able to make informed decisions. That’s not to say you can or should move slowly—you can’t. Speed is key to ecommerce growth. You have to be able to quickly identify opportunities, fill gaps, and pull the right levers. But you should never plunge into total darkness. You need to lean on evidence and validation to some extent when deciding which of your growth ideas and strategies to move forward with. Retail data can help you make the right decisions.
So the question is, where do you go to find it? The data you ultimately leverage to boost profits and business growth will depend a lot on the nature of your business (industry, location, size, customer demographics, etc.), but there are a number of data resources that every ecommerce business owner can leverage to fuel growth.
Here are five of my favorites:
Resource #1: Online Shopping and E-Commerce Surveys from The Pew Research Center – The Pew Research Center is a great source to leverage to find up-to-date information on shopping trends. The organization is frequently performing new studies and releasing new information aimed at helping business owners better understand the behaviors and tendencies of online shoppers.
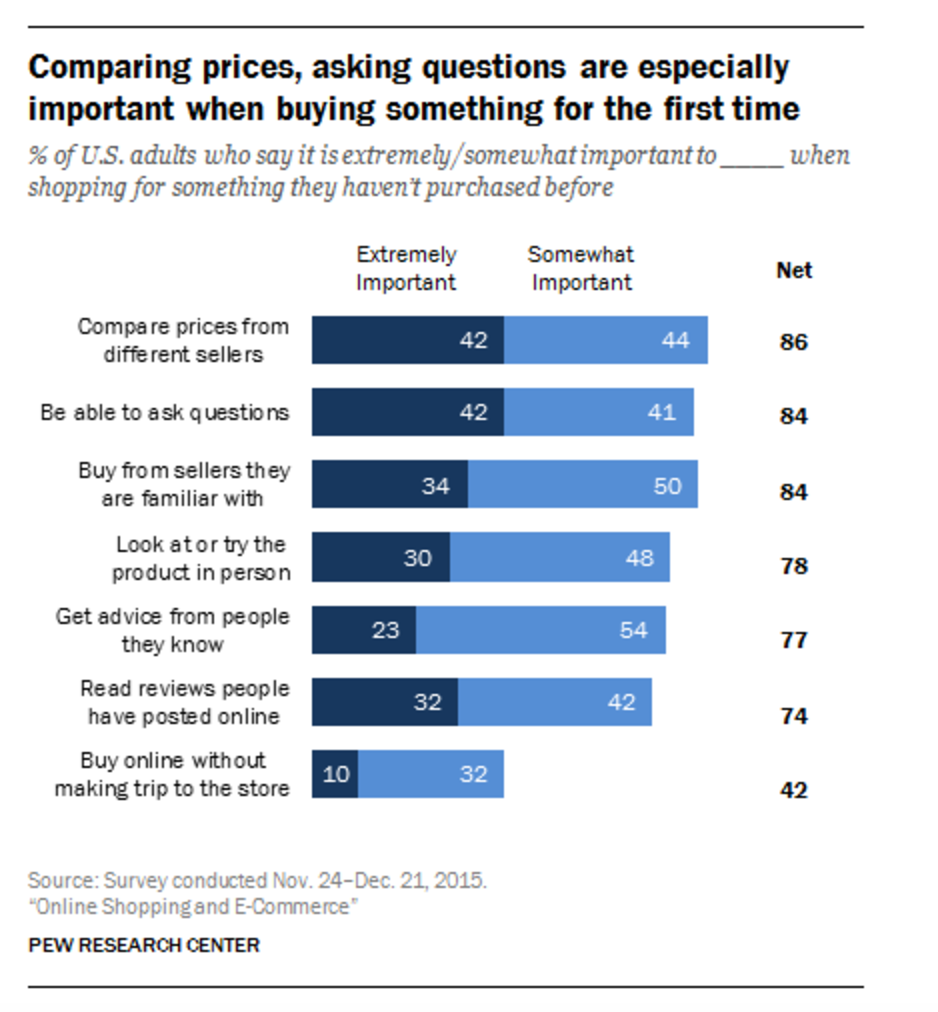
In their latest resource, Pew surveyed and received responses from 4,787 people about their shopping habits and preferences. The resource is heavy on data, but also includes a good amount of visual graphs that make the study easier to digest, as you can see in the example here:
Here are some highlights from the survey results that I found particularly interesting:
- Online shopping is more popular than ever. 8 out of 10 Americans are now online shoppers, 51% of people have bought something using a cellphone.
- Social media matters. 15% have made purchases by following a link from social media sites.
- Price is a big driver for people. 65% of those surveyed said that when they need to make purchases, they compare the price they can get in stores with the price they can get online and choose whichever option is cheapest.
- Social proof is powerful. 40% of Americans say they turn to online reviews when buying something new.
To get the PDF version of this report by the Pew Research Center, click here.
Resource #2: What Are Connected Shoppers Doing and Not Doing Online? Report from Nielsen – Another great source for up-to-date information on shopping behavior is Nielsen. This survey is quite different from the Pew Research Center survey above because it compiles data from countries all around the world. Instead of just focusing on American online shoppers, it seeks to present a more complete, global view. According to the resource, the findings in this survey are based on an online survey in 24 countries and a face-to-face survey in two countries.
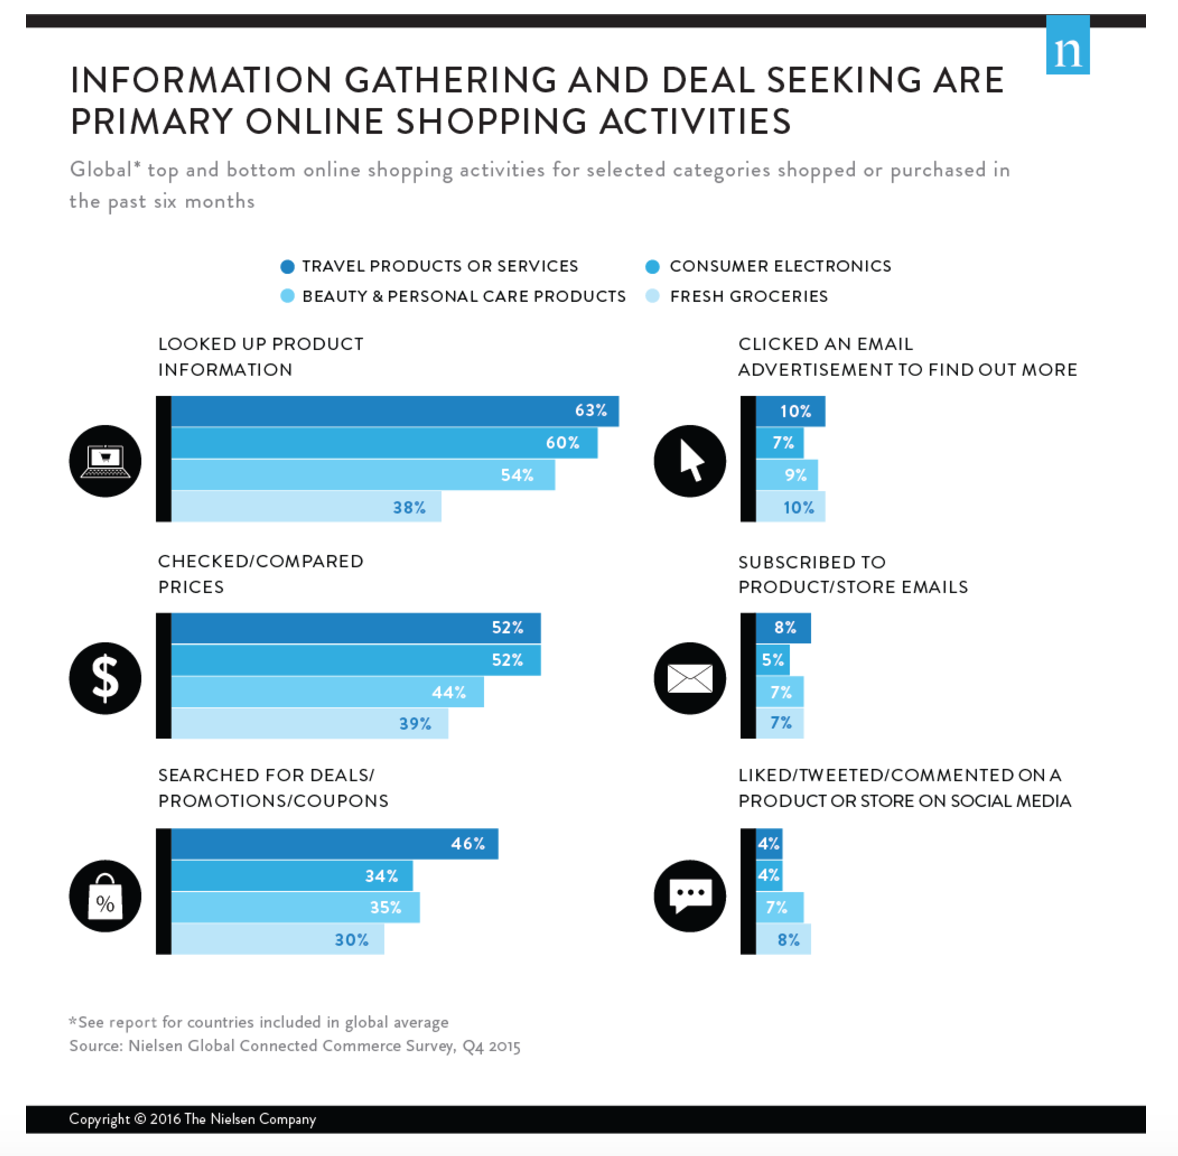
Like the Pew report, this report from Nielsen also includes a handful of graphics aimed at making the findings easier to quickly scan and understand, as you can see below:
Here are some highlights from the survey results that I found particularly interesting:
- International trust is growing. More than half of online respondents in the study who made an online purchase in the past six months say they bought from an overseas retailer (57%).
- Privacy and security is still an issue that matters. More than half of all online respondents in the study (57%) have doubts that e-commerce sites will keep their personal information secure and confidential.
- Alternative digital payment systems are becoming more popular. More than half of online respondents who say they shopped online during the past six months paid with a credit card (53%). In addition, roughly four-in-10 used a digital payment system such as PayPal or Alipay (43%), debit card (39%) or direct debit from their bank account (38%).
To download the full report, go to this page. The 38-page report is free, but Nielsen does ask you to provide them with a bit of information about yourself.
Resource #3: Total Retail Survey Reports from PwC – PwC also conducts and publishes an annual survey about online shopping trends. Like the Nielsen report, this resource also approaches things from a global perspective. To compile their findings, PwC surveyed nearly 23,000 online shoppers from 5 continents and 25 territories. If you sell a lot of products internationally, this will probably be one of the more useful resources for you to leverage when making decisions about your ecommerce business.
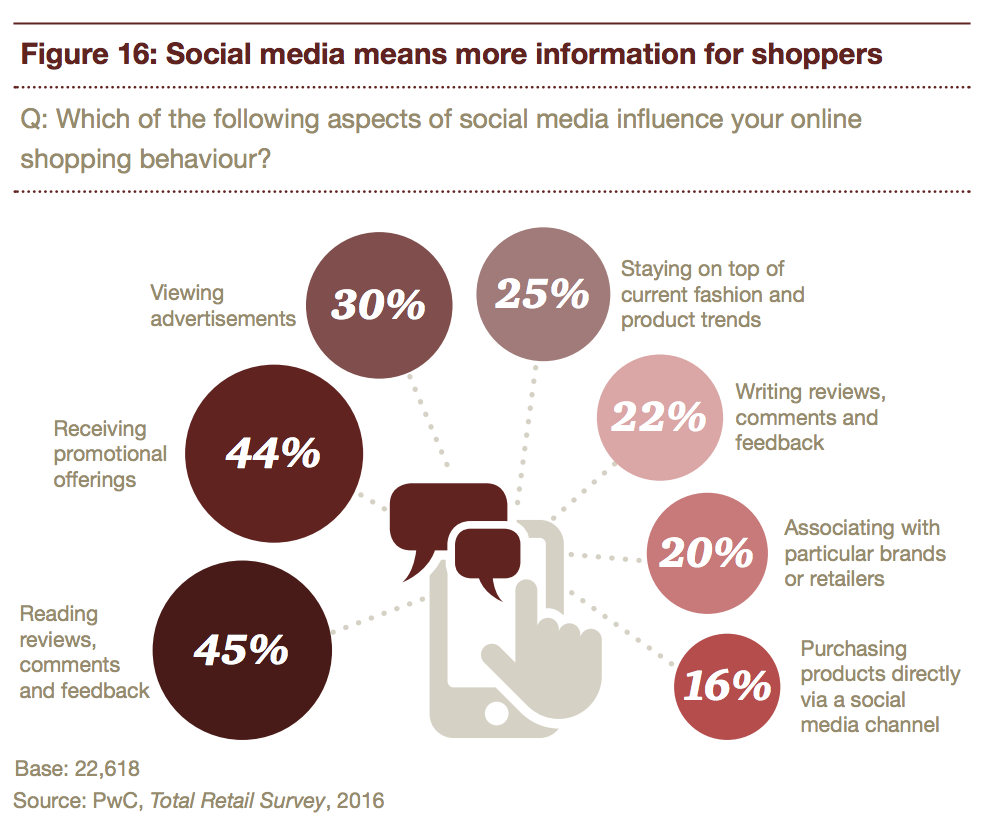
As with the other resources listed, it includes plenty of quick graphics that will provide you with a snapshot of the findings they compiled from respondents.
Here are some highlights from the survey results that I found particularly interesting:
- Customers are shopping internationally to get better deals.The two highest-earnings income brackets in each of the surveyed countries plan to purchase from an out-of-country online retailer in the next 12 months for better prices.
- Millennials are brand-loyal. Millennials shop at their favorite retailer for brand affinity (33%), superior online customer reviews (17%), reliable delivery (25%) and an easy-to-use website or mobile site (23%).
- VIP still works. 91% of the global survey sample reported that they are a member of a loyalty/reward program.
To download the full report, scroll to the bottom of this page and click on the download button.
Resource #4: Shopping Insights from Google – Shopping Insights from Google is a bit different than the other resources mentioned in this post. This resource is interactive, so you can use it to really drill down into topics and geographic areas that relate most to your business, your products, and your customers. Shopping Insights allows anyone to explore trends and popularity of products across the U.S.
You can either use the tool to compile your own report about a product or grouping of products, or you can review some of the already-compiled reports that Google has created based on popularity and demand. For example, here are some reports you can view:
- Shoe Preferences, Broke Down by Region [Click to Explore]
- XBox One vs PS4: Which Console is More Popular? [Click to Explore]
- Top Mother’s Day Products from 2015 [Click to Explore]
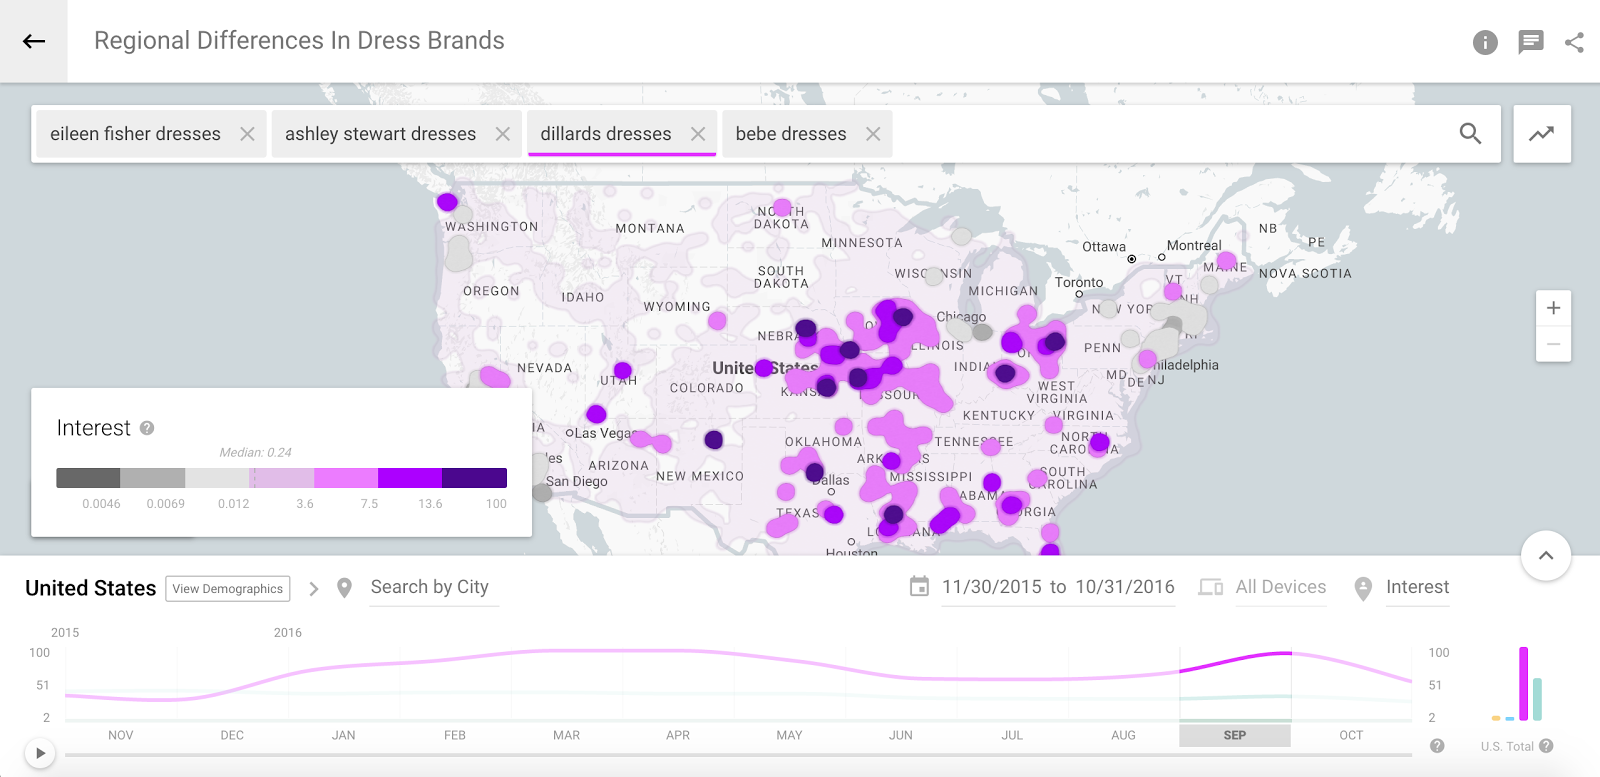
In the graphic above, what you’re looking at is a comparison between four dress brands. Using the tool, you can drill down into popularity by region, query volume over a 12-month period, age distribution, household income, and monthly breakdowns.
Resource #5: The Annual UPS Pulse of the Online Shopper Study – The final resource in my list comes from an annual online shopping survey conducted by UPS in association with comScore, Inc. 5,330 online shoppers were surveyed and had to meet the following criteria to participate: shoppers had to have made at least 2 online purchases in a typical 3-month period.
This 64-page report is incredibly thorough and very well-organized, so it’s definitely worth spending some time on when you’re working on developing new growth strategies for your business.
Here are some highlights from the survey results that I found particularly interesting:
- Millennials like to multi-task. According to the report, millennials are more likely to have made a new purchase when processing a return on the web.
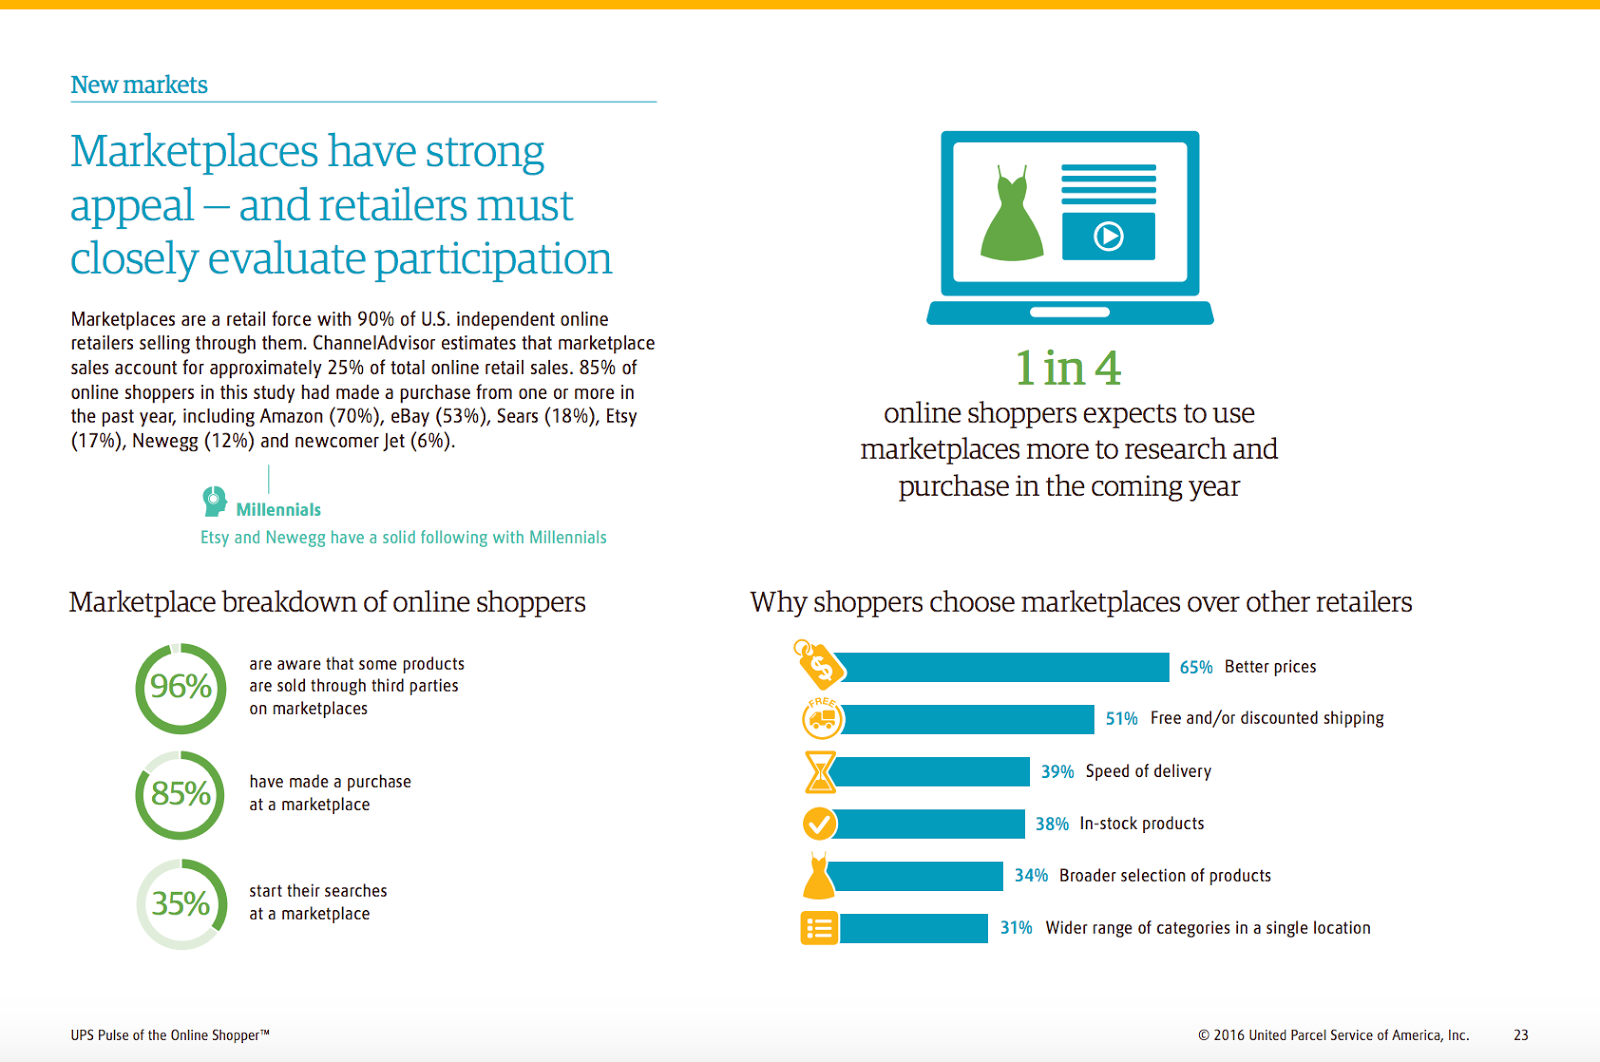
- Multichannel participation is important. 35% of respondents start their searches at a marketplace. In fact, starting a search at a retailer’s store is down from 18% to 13% over a two-year period.
- The relationship between social media and shopping continues to evolve. 23% of online shoppers found the ability to add an item to a cart by using a hashtag on social media appealing.
To download the full report, navigate to this page and click the download button at the top of the page.
How to Leverage Data
Once you’ve spent some time going through resources that offer online shopping trend and online consumer behavior data, your next step is to decide how to work what you’ve read into your growth strategies. Before diving in head first though, it’s important to keep in mind: every survey is different and will present different data. Some might even present conflicting data. So don’t rush to make changes based solely on a statistic or data point you read. Instead, think about the nature of your own business and your own audience and what their behavior has been like historically. From there, come up with hypotheses and quick small-scale tests that you could potentially run in order to make an impact on sales.
Here are a few examples of how you could leverage data to boost sales and growth at your business:
Example #1: Say you read that price is an incredibly important factor to most shoppers, and that shoppers typically do their own pricing research and comparisons before making a decision about whether to purchase a product. To help steer them toward your business and products, you could create price comparison and feature comparison charts on your product pages that help people understand why your products are priced the way they are, and how they compare to products by competitors.
By doing this, you’re helping them perform research that they would have already done on their own, but you’re keeping them on your website instead of sending them elsewhere to get their answers. If you really wanted to get aggressive with this one, you could also offer to price-match in order to ensure that visitors buy from you and not the other guy.
Example #2: Say you read that privacy and security is still a big issue for most online consumers. To build trust, you can add security badges and copy to your website, product pages, and checkout process that helps remind your customers that their information will be kept safe and protected when they buy from you.
To test the effectiveness of this tactic, include trust badges on some product pages and leave them off of others. See how conversions are impacted over time, then based on findings, make permanent adjustments across your store.
Example #3: Say you learn that multichannel is extremely important, and that many online shoppers actually start their product searches on Amazon rather than going directly to an ecommerce store (hint: we just talked about this earlier in this post). You can invest in a tool like Sellbrite to ensure that potential customers are seeing your business and products when searching on third-party marketplaces. Tools like Sellbrite will help you manage and streamline all the work that goes into managing inventory across multiple marketplaces and websites.
From these examples, you can start to imagine the endless opportunities and ideas that can be uncovered when you spend more time digging into actual shopping and retail data. But you have to know where to look, and you have to allocate enough time to spend digging into the reports. It’s the only way you’ll be able to make informed decisions about how to drive more sales, and where to take your ecommerce business next.
Over to You
Where do you go when you’re looking for online shopping trend data? Do you have a favorite source or influencer you follow? Tell me in the comments below.


2 thoughts on “How to Find and Leverage Retail Trend Data to Grow Your Business”
Great post, William! So many good sources of data for the merchant whose truly ready to get ahead of their competition.
Thanks, Mike. That’s the goal – if you want to get ahead, you need a map.